Wednesday, April 2, 2014

Data Driven Testing in TestNG using Data Provider

In the previous post we have looked at how to optimise test cases for data driven testing. Now let us look how to automate these Tests.

In a typical scenario QA engineer will manually use allpairs tool and determine optimal set of Test Data for conducting data driven testing. This test data will be in excel sheet.

Now let us write a method to read this data.


Now let us write DataProvider for using this code and passing one set of data at a time to TestNG for running the same Test case multiple times (Data driven Testing).

Let us write actual test case and make it to use this data provider


This will make TestNG to execute testDND test case for 56 times each time with different Test Data. But the biggest problem with this approach is in testng results it will show same method name for every execution. But it will show the actual test data as parameters in test.html.

We can use code like below to add TestCase name


~Yagna

Pairwise Test Cases for Data Driven Testing in Agile World

It is a common scenario where a Test Case should be run with more than one set of Test Data. Let us take an example to illustrate this scenario.

A screen has following 4 input parameters. 

  1. Name - Text Field which takes only alphabets
  2. Phone Number - Text Field takes only numbers
  3. Don't Disturb - Radio Button with Yes and No options
Now the possible values for 
  1. Name - alphabets, alpha-numeric characters, special characters, unicode characters, empty string, space, very long string
  2. Phone Number - numbers, alphabets, alpha-numeric characters, special characters, unicode characters, empty string, space, very long number
  3. Don't Disturb - Yes, No
Now if we want to come up with Test cases using combinations of this data we will get

7*8*2 = 112 Test Cases
But Pairwise Testing philosophy says

Most bugs are found when only two variable values conflict, not when all conflict at the same time. (Ref: Efficient Testing with All-Pairs - Prepared for STAREast 2003 International Conference on Software Testing Bernie Berger)
 So let us try to reduce these test cases using pairwise tool.

  1. Download and extract tool from www.saticefice.com
  2. Create an excel sheet with Variables as headers(columns) and values as rows
  3. Save it as .txt file with tab delimited file
  4. now say perl allpairs.pl blog.txt >allpairs.txt
  5. Open the file allpairs.txt using excel or numbers(in case of mac)
  6. Now you can see all the available test cases


Test cases reduced to half in this case.

~Yagna

Code coverage report using Cobertura with gradle

According to wikipedia Code coverage is

code coverage is a measure used to describe the degree to which the source code of a program is tested by a particular test suite. A program with high code coverage has been more thoroughly tested and has a lower chance of containing software bugs than a program with low code coverage. Many different metrics can be used to calculate code coverage; some of the most basic are the percent of program subroutines and the percent of program statements called during execution of the test suite.

There are several tools which help in getting code coverage. Out of then Cobertura is one. From the official site of Cobertura

Cobertura is a free Java tool that calculates the percentage of code accessed by tests. It can be used to identify which parts of your Java program are lacking test coverage. It is based on jcoverage.
Gradle is a popular build tool. Many a times one would like to get code coevage report during build time about Unit Tests' code coverage. This can be easily achieved using following piece of code in build.gradle

1. Using Cobertura with gradle

paste this in build.gradle


buildscript {
    repositories {
        mavenCentral()
    }
    dependencies {
        classpath "net.saliman:gradle-cobertura-plugin:1.1.0"
    }
}

apply plugin: 'cobertura'

This will give you 2 new tasks called instrument and cobertura

instrument task will instrument the classes of the project. And cobertura task will build > instrument > test > createReport


test Task will build and run the classes in src/test folder. These are unit tests of the project


Code coverage report for Unit Tests is as follows 


2. QA Tests

QA can also use gradle in their project and run tests or can follow following process

Download cobertura from cobertura.sourceforge.net 

To Compile Test Code

javac -cp ~/Desktop/cobertura-2.0.3/cobertura-2.0.3.jar:projectname/build/classes/main/Test.java


To Run Test Code on instrumented classes

java -cp ~/Desktop/cobertura-2.0.3/cobertura-2.0.3.jar:projectname/build/classes/main/:. -Dnet.sourceforge.cobertura.datafile=cobertura.ser Test


To Create Cobertura Report Outside gradle

~/Desktop/cobertura-2.0.3/cobertura-report.sh --format html --datafile cobertura.ser --destination coverage projectname/src/

3. Merge reports

Once both the reports are ready we can use following command to merge

./cobertura-merge.sh --datafile cobertura.ser cobertura1.ser 

now create report using command

cobertura.ser --destination coverage projectname/src/

4. Check for a condition on code coverage

~/Desktop/cobertura-2.0.3/cobertura-check.sh --datafile projectname/build/cobertura/cobertura.ser  --line 30

~Yagna

Tuesday, July 23, 2013

Writing Sample plugin for Jenkins


There are so many plugins available for Jenkins which will cater most of your needs. But there are chances where you have to write your own plugin.
Jenkins Plugin should be developed in java and we have to create a .hpi file out of that. But don't be panic about this as this can be done automatically. Process is as follows.

Step 0: Set ~/.m2/settings.xml as specified in https://wiki.jenkins-ci.org/display/JENKINS/Plugin+tutorial

Step 1: On a linux machine
mvn -U org.jenkins-ci.tools:maven-hpi-plugin:create


Step 2: This will give create sample code. Now
cd newly-created-directory
mvn package

Most probably you will get an error saying 

libjna-java mvn test failed with java.lang.UnsatisfiedLinkError: com.sun.na.Native.open(Ljava/lang/String;)J 
at com.sun.jna.Native.open(Native Method)  
at com.sun.jna.NativeLibrary.getInstance(NativeLibrary.java:236)  
at com.sun.jna.Library$Handler.<init>(Library.java:140)  
at com.sun.jna.Native.loadLibrary(Native.java:366)  
at com.sun.jna.Native.loadLibrary(Native.java:351)  
at hudson.util.jna.GNUCLibrary.<clinit>(GNUCLibrary.java:105)

This is because of a known issue.

Workaround would be add the following lines to your project's pom.xml inside the dependencies node and if not existing create dependencies node

<dependency>
               <groupId>net.java.dev.jna</groupId>
               <artifactId>jna</artifactId>
               <version>3.2.2</version> 
</dependency>

Step 4: After doing that use following command
mvn install
Now you can see a hpi file created in target directory.

Step 5: Run the newly created plugin using command
export MAVEN_OPTS="-Xdebug -Xrunjdwp:transport=dt_socket,server=y,address=8000,suspend=n"
mvn hpi:run


Step 6: Open your favorite Browser and go to http://127.0.0.1:8080 which will show you following screen

Step 7: Create a new Job and in build steps you can see "Say Hello world" as a Task. Add this with some name.

Step 8: Now build this project and you can see Hello world output as shown below

~ Yananarayana Dande


Monday, July 22, 2013

Jenkins - A Centralized Tool to run your Automated Tests

Most of the times Test team will end up writing different test harnesses to test different components and there should be  a platform from which a user can start a run of specific automation suite on a specified environment with given configurations remotely using a web page. For achieving this and other features listed below I was given a task by my manager to design a Tool. 

I have selected Jenkins and customized it to achieve this. 

Features
  • Single Sign-on for all your Automation Needs
  • Common Console for starting any Automation Run
  • Configure all your Automation Suites from a single place
  • Horizontal coverage by adding all automation suites 
  • Vertical dig down possible for an Automation Engineer to understand root cause for Test failures
  • Email Notification once run in completed
  • Confluence Page is updated with results/custom message once run is completed
  • Code Coverage can be published
How to Achieve this
  1. Install Jenkins 
    1. Follow instructions given at https://wiki.jenkins-ci.org/display/JENKINS/Installing+Jenkins
  2. User Management
    1. Use LDAP Plugin by following instructions given at https://wiki.jenkins-ci.org/display/JENKINS/LDAP+Plugin
  3. To change standard Appearance to suite your organizational rules 
    1. Use Simple Theme Plugin by following instructions given at https://wiki.jenkins-ci.org/display/JENKINS/Simple+Theme+Plugin
    2. Use Dashboard View Plugin by following instructions given at https://wiki.jenkins-ci.org/display/JENKINS/Dashboard+View  
  4. To add and manage nodes
    1. Use Node and Label parameter plugin by following instructions given at  https://wiki.jenkins-ci.org/display/JENKINS/NodeLabel+Parameter+Plugin
    2. Use Multi Slave config plugin by following instructions given at https://wiki.jenkins-ci.org/display/JENKINS/Multi+slave+config+plugin
    3. Use Jenkins Slave Setup Plugin by following instructions given at  https://wiki.jenkins-ci.org/display/JENKINS/Slave+Setup+Plugin
  5. For Code Control
    1. Use Git Plugin by following instructions given at https://wiki.jenkins-ci.org/display/JENKINS/Git+Plugin
  6. Build
    1. Use Jenkins Gradle Plugin by following instructions given at  https://wiki.jenkins-ci.org/display/JENKINS/Gradle+Plugin
  7. Test Results
    1. Copy To Slave Plugin has Bug - JENKINS-14578 so we decided using NFS instead
    2. Use TestNG Results Plugin  by following instructions given at https://wiki.jenkins-ci.org/display/JENKINS/testng-plugin
  8. Publish
    1. Use build-user-vars-plugin by following instructions given at https://wiki.jenkins-ci.org/display/JENKINS/Build+User+Vars+Plugin
    2. Use Jenkins Email Extension Plugin by following instructions given at https://wiki.jenkins-ci.org/display/JENKINS/Email-ext+plugin
    3. Use Confluence Plugin by following instructions given at https://wiki.jenkins-ci.org/display/JENKINS/Confluence+Publisher+Plugin
  9. Code Coverage Tool
    1. Use Jenkins Cobertura Plugin  by following instructions given at https://wiki.jenkins-ci.org/display/JENKINS/Cobertura+Plugin

Adding a New Slave


  1. As a first step add a slave node in Jenkins UI


Start Slave process

  • wget http://[your jenkins host]:[port number]/jnlpJars/slave.jar
  • ${NOHUP} ${JAVA} -jar slave.jar -jnlpUrl http://SERVERNAME:PORT/computer/USER__NODENAME/slave-agent.jnlp &

Then you can see the slave at Slaves Page


Configuring a New Project

  • Fill the Project name, description for the project and Location of code on github
     
  • Add Parameters required for the project to run. So these are called as build Parameters, which means these will change per build.
  • Bind this project to a given node
  • Use Custom workspace to parse your results
  • Give the build steps
  • Specify files to be processed by testng-plugin for giving results and to create trend graph
  • Create an editable e-mail notification as a Post Step so that it sends email notification to selected people in the organisation in the given format
  • Create a Publish Task as Post build step to publish your results in Confluence


Your centralized Tool is ready and you can run your Automated Tests now :) 

Build Now(Run Tests)

From left hand pane in the project page say "Build Now" and it will take you to following screen

Now give the build parameters and say build. This will start running your test cases.

Tests' output in Console

You can have a look at the running tests in the console (Select console from Left Pane) as shown below


Also once tests are completed you can see the TestNg reports and Trends as shown below


Also you can see from which build this test cases is failing when you dig the links in TestNG reports


Dashboard

You can collect different statistics on a dashboard page as shown below


Also an email Notification is sent after the run

Confluence Update

After every run it will update the results in the configured confluence page

Happy Testing :)

~Yagnanarayana Dande


Wednesday, August 22, 2012

Robot Test Automation Framework - Write your test library in Python and/or Java


             In this tutorial I will help you to write a simple program in Robot Test Framework. As usual we will start with installation.

             For Robot to work we need Python, Jython, WxPython to be installed on the machine. So lets first install them before we do anything else.
Python Installation 
Step 1: Download Python for Windows from http://www.python.org/getit/windows/ and doubleclick on the installer


Step 2: Complete the installation


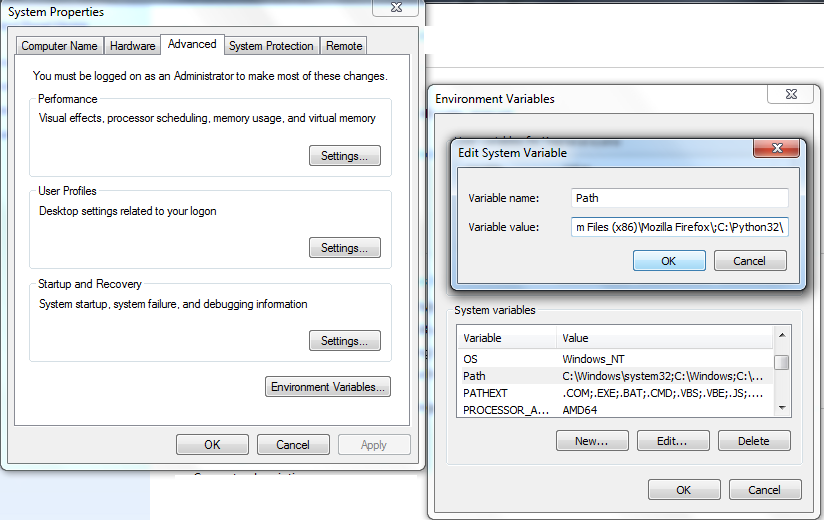
Step 3: Put Python bin directory in the environment Variable PATH


Step 4: Verify the installation by typing 'python' on your command prompt


Jython Installation 
          Using test libraries implemented with Java or using Java tools internally requires running Robot Framework on Jython, which in turn requires Java Runtime Environment (JRE). 

           Installing Jython is a fairly easy procedure, and the first step is getting an installer from http://jython.org. The installer is an executable JAR package, which you can run from the command line like java -jar jython_installer-<version>.jar. 

           Depending on the system configuration, it may also be possible to just double-click the installer.

Step 1: Download Jython for Windows from http://jython.org/downloads.html and on command prompt type 'java -jar jython_installer-<version>.jar' where <version> needs to be replaced by the actual version


Step 2: Complete the installation process


Robot Installation
Step 1: Download Robot for Windows from http://downloads.robotframework.org/ and double click on the installer


Step 2: Complete the installation process


 WxPython Installation
Step 1: Download WxPython for Windows from http://wxpython.org/download.php#stable and double click on the installer


Robot-RIDE Installation
Step 1: Download Robot-RIDE for Windows from https://github.com/robotframework/RIDE/downloads/ and double click on the installer

Step 2: On command prompt go to scripts directory where python is installed <PYTHON_INSTALLED_DIR>\scripts and type 'ride.pyc'. You will see following screen where you can write your Test cases


Writing simple Test Case in Robot-RIDE
         Let us write a Test Case to check whether a particular directory exists or not on our machine.
     
        From file menu select new project give it some name like Example. Now right click on this project and select New Test Case. Give it some name like My Test. Also right click on project and select New User Keyword and give a name like My Keyword.

       There are some libraries which are by default provided by Robot like OperatingSystem which provides functionality of some operating system keywords like File operations, directory operations, etc...

        So we first import this library in the Project Page. Also Add Scalars for all variables you need to use in your Tests like path and MESSAGE in this case.


                    In the Test Case page, write your test case like <keyword> and <arg1> <arg2> .... In this case Log and My Keyword are keywords and ${MESSAGE} and ${path} are args.


                 Where My Keyword is a keyword created by user by adding some available keywords from library as show below. In this case we are using Directory Should Exist keyword and argument as ${path}.


 Running Test Case in Robot-RIDE
           Simply hit the Run button shown as "robot face" in the robot-RIDE screen.


Logs of Test Case in Robot-RIDE
          Below is a sample log file


Reports in Robot-RIDE
          This is a sample report in Robot-RIDE


We can also write our own libraries in Robot using either Java or Python. We will look into it in later posts.

~Yagnanarayana Dande

Thursday, January 12, 2012

Running Hadoop Pig Scripts with MapR Demo VM


What is Hadoop Pig?

Apache Pig is a platform for analyzing large data sets. Pig's language, Pig Latin, lets you specify a sequence of data transformations such as merging data sets, filtering them, and applying functions to records or groups of records. Pig comes with many built-in functions but you can also create your own user-defined functions to do special-purpose processing.

Pig Latin programs run in a distributed fashion on a cluster (programs are complied into Map/Reduce jobs and executed using Hadoop). For quick prototyping, Pig Latin programs can also run in "local mode" without a cluster (all processing takes place in a single local JVM).

How to install?

Download VMWare Player at
http://downloads.vmware.com/d/info/desktop_downloads/vmware_player/3_0
Download MapR Demo VM at
http://package.mapr.com/releases/v1.2.0/vmdemo/MapR-VM-1.2.0.12140GA-1-m3.tar.bzip2

1. Extract this using
bunzip2 MapR-VM-1.2.0.12140GA-1-m3.tar.bzip2 (This shows some errors but you can ignore them)
tar -xvf MapR-VM-1.2.0.12140GA-1-m3.tar (if output file is not .tar and is tar,out still its okay)
2. After untartting this transfer it to Windows machine
3. Install VMWare Player and start the Demo VM


How to Run it?

local mode


mapreduce mode


Problem to Solve

Marks of Students in Unit Test1 in Subjects Telugu, Hindi, English, Maths, Science and Social respectively. Now Class Teacher wants to Find all the students who are Failed?


Pig Script to solve this

A = load 'Unit1' using PigStorage('\t') as (Name:chararray,Telugu:int,Hindi:int,English:int,Maths:int,Science:int,Social:int);

B = filter A by Telugu < 35 OR Hindi < 35 OR English < 35 OR Maths < 35 OR Science < 35 OR Social < 35;


DUMP B;


Here is the Output of the Pig Script