Monday, April 27, 2015

Automated Testing of Multi Browser Support using SauceLabs and Jenkins/Hudson


               Its not an easy task to run automated tests on multiple browsers and gather results back to a single location. Its not a good option to have your own setup of all Operating System + Browser combinations in a lab if you don't have a dedicated operations team.

             We can use cloud solutions like Saucelabs for this purpose. Saucelabs provides on demand instance of Operating System + Browser. It uses Remove Webdriver concept to run Selenium Tests on these instances.

             You can use following code to start a remote Run


Now create a Jenkins job with configuration as


Now you are ready for your Multi Browser tests. Start a build and test will execute on Saucelabs. 

Once you launch your tests, logon to saucelabs.com and watch the live steaming on how tests are being executed or wait till end to see TestNG report on Jenkins


~Yagnanarayana Dande

Running Selenium Tests on a headless Jenkins Server

                            QA needs to execute their daily Sanity Tests on Jenkins. To run Selenium Tests we need a machine connected to monitor. And if we don't have such an arrangement then we can follow the steps below to run Selenium Tests on a headless Jenkins Server.

Never run daily runs on tools like Saucelabs.com or browserstack as its a costly affair.

1. Install Xvfb on Jenkins Server


yum install xorg-x11-server-Xvfb

2. Install Firefox on Jenkins Server

yum install firefox
3. Install https://wiki.jenkins-ci.org/display/JENKINS/Xvfb+Plugin on Jenkins


4. In you Job, configure as follows


5. When you run the Job, it will create a screen and execute tests on that screen with GUI


Enjoy your daily runs now :)

~ Yagnanarayana Dande

Thursday, March 19, 2015

Integration of TestLink with Jenkins/Hudson to Run Automated Tests


Install the TestNG Plugin on Jenkins


Get API Key from TestLink -> Test Project Management -> API Key


 Go to Jenkins -> Manage Jenkins -> Configure System Add following


Go to Jenkins -> Automation Project -> Build -> Invoke TestLink


Invoke TestLink has 3 Parts

1. Test Link Configuration 
(Using these details Jenkins can get details about Test Cases from TestLink)


 2. Test Execution
(Using this Jenkins execute Test Cases)

3. Result Seeking Strategy
(Using this Jenkins Posts Test Results to TestLink)


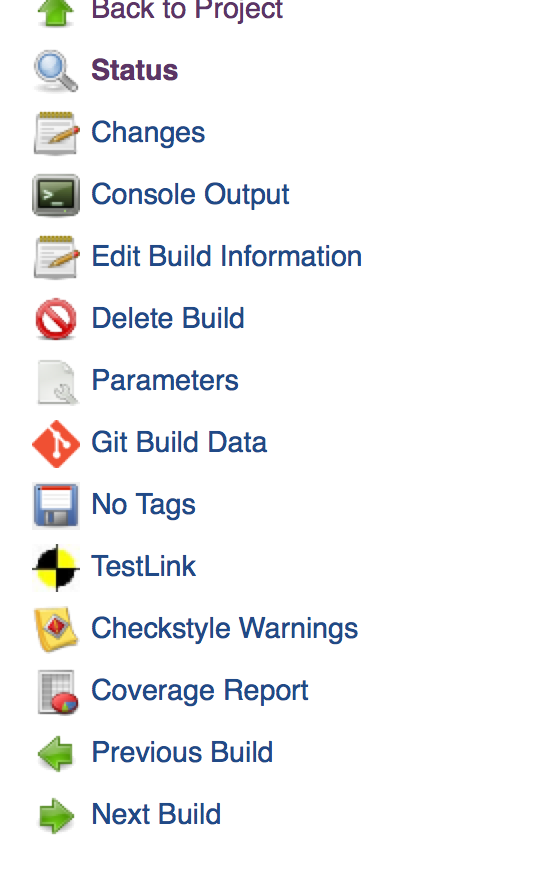
Click on Any Build in Jenkins and it shows TestLink Results 


On Right Side Pane of Automation Project, You can see TestLink 


~Yagnanarayana Dande

Wednesday, April 2, 2014

Data Driven Testing in TestNG using Factory Pattern

In the previous post we have looked at how to write test cases for data driven testing using data provider. Now let us look how to do same using Factory pattern.


Reading excel sheet will be same as previous


Now let us use Factory annotation and passing one set of data at a time to TestNG for running the same Test case multiple times (Data driven Testing). The main difference between Factory pattern and dataProvider is that in dataProvider all the tests will be called on a single instance and in factory pattern each test case will be called on different instances.


Here every test data will have a corresponding object of the class ProjectTestCases.

~Yagna

Data Driven Testing in TestNG using Data Provider

In the previous post we have looked at how to optimise test cases for data driven testing. Now let us look how to automate these Tests.

In a typical scenario QA engineer will manually use allpairs tool and determine optimal set of Test Data for conducting data driven testing. This test data will be in excel sheet.

Now let us write a method to read this data.


Now let us write DataProvider for using this code and passing one set of data at a time to TestNG for running the same Test case multiple times (Data driven Testing).

Let us write actual test case and make it to use this data provider


This will make TestNG to execute testDND test case for 56 times each time with different Test Data. But the biggest problem with this approach is in testng results it will show same method name for every execution. But it will show the actual test data as parameters in test.html.

We can use code like below to add TestCase name


~Yagna

Pairwise Test Cases for Data Driven Testing in Agile World

It is a common scenario where a Test Case should be run with more than one set of Test Data. Let us take an example to illustrate this scenario.

A screen has following 4 input parameters. 

  1. Name - Text Field which takes only alphabets
  2. Phone Number - Text Field takes only numbers
  3. Don't Disturb - Radio Button with Yes and No options
Now the possible values for 
  1. Name - alphabets, alpha-numeric characters, special characters, unicode characters, empty string, space, very long string
  2. Phone Number - numbers, alphabets, alpha-numeric characters, special characters, unicode characters, empty string, space, very long number
  3. Don't Disturb - Yes, No
Now if we want to come up with Test cases using combinations of this data we will get

7*8*2 = 112 Test Cases
But Pairwise Testing philosophy says

Most bugs are found when only two variable values conflict, not when all conflict at the same time. (Ref: Efficient Testing with All-Pairs - Prepared for STAREast 2003 International Conference on Software Testing Bernie Berger)
 So let us try to reduce these test cases using pairwise tool.

  1. Download and extract tool from www.saticefice.com
  2. Create an excel sheet with Variables as headers(columns) and values as rows
  3. Save it as .txt file with tab delimited file
  4. now say perl allpairs.pl blog.txt >allpairs.txt
  5. Open the file allpairs.txt using excel or numbers(in case of mac)
  6. Now you can see all the available test cases


Test cases reduced to half in this case.

~Yagna

Code coverage report using Cobertura with gradle

According to wikipedia Code coverage is

code coverage is a measure used to describe the degree to which the source code of a program is tested by a particular test suite. A program with high code coverage has been more thoroughly tested and has a lower chance of containing software bugs than a program with low code coverage. Many different metrics can be used to calculate code coverage; some of the most basic are the percent of program subroutines and the percent of program statements called during execution of the test suite.

There are several tools which help in getting code coverage. Out of then Cobertura is one. From the official site of Cobertura

Cobertura is a free Java tool that calculates the percentage of code accessed by tests. It can be used to identify which parts of your Java program are lacking test coverage. It is based on jcoverage.
Gradle is a popular build tool. Many a times one would like to get code coevage report during build time about Unit Tests' code coverage. This can be easily achieved using following piece of code in build.gradle

1. Using Cobertura with gradle

paste this in build.gradle


buildscript {
    repositories {
        mavenCentral()
    }
    dependencies {
        classpath "net.saliman:gradle-cobertura-plugin:1.1.0"
    }
}

apply plugin: 'cobertura'

This will give you 2 new tasks called instrument and cobertura

instrument task will instrument the classes of the project. And cobertura task will build > instrument > test > createReport


test Task will build and run the classes in src/test folder. These are unit tests of the project


Code coverage report for Unit Tests is as follows 


2. QA Tests

QA can also use gradle in their project and run tests or can follow following process

Download cobertura from cobertura.sourceforge.net 

To Compile Test Code

javac -cp ~/Desktop/cobertura-2.0.3/cobertura-2.0.3.jar:projectname/build/classes/main/Test.java


To Run Test Code on instrumented classes

java -cp ~/Desktop/cobertura-2.0.3/cobertura-2.0.3.jar:projectname/build/classes/main/:. -Dnet.sourceforge.cobertura.datafile=cobertura.ser Test


To Create Cobertura Report Outside gradle

~/Desktop/cobertura-2.0.3/cobertura-report.sh --format html --datafile cobertura.ser --destination coverage projectname/src/

3. Merge reports

Once both the reports are ready we can use following command to merge

./cobertura-merge.sh --datafile cobertura.ser cobertura1.ser 

now create report using command

cobertura.ser --destination coverage projectname/src/

4. Check for a condition on code coverage

~/Desktop/cobertura-2.0.3/cobertura-check.sh --datafile projectname/build/cobertura/cobertura.ser  --line 30

~Yagna